


Frequency measurement is one of the main requirements for many applications. The most obvious the frequency measurement method is using CRO (or nowadays using DSO). But this instrument is not portable or available with all students or hobbyists at any time. It’s actually a lab tool and not the portable one. It is also more expensive. Also, conventional CRO does not give the value of the read frequency. One must first establish the waveform, then find the time / division and fine calculate the time period and frequency.
So it is a long process that takes time. Another way is to use it frequency counter that will give us a direct digital frequency reading. In this case, the first one is no longer needed adjust the waveform on the screen then find the time / division and then calculate the time period and frequency, such as CRO. Just apply the input signal and get the frequency reading. Because frequency meters that find their place in the measuring instruments.
The RPM meter finds its importance in so many industries that it measures the current RPM of any motor. Measuring current engine speed and based on this decision, such as increasing RPM or decreases, is the main requirement. In some applications it is necessary to maintain the RPM a engine within the desired limits. Therefore, the RPM is continuously measured and taken as feedback. If this value goes far beyond the limits, immediate actions can be taken.
Here I present a single circuit to measure the frequency as well as the RPM. This circuit can alternatively measure the frequency or RPM using a switch. If the switch is connected to
- Direct signal input – measures the frequency
- Sensor output (opto-interrupt) – measures RPM.
It also measures the frequency or RPM once or in a continuous loop after every 5 seconds. Let us see some other features of this circuit
- measures the frequency from 50 Hz to 65 KHz
- measures RPM from 5 to 9999
- uses non-contact RPM sensor
- Digital output with 16×2 LCD text
- option for continuous measurement
Let’s first look at the block diagram of the system
System block diagram:


The main building blocks are the wave modeling circuit, the sensor, the micro-controller and the LCD.
Wave shapping circuit: transforms any input signal into pulses (unipolar rectangular or square).Its power is between 0 and 5 V. So, in fact, it transforms the shape of the input signal into the type of shape which can be recognized by the micro-controller.
Optointerruptible sensor: turns every engine revolution into a pulse. So we will receive directly results as number of rotations = number of impulses.
Micro-controller: counts the number of pulses (either from the sensor or a direct signal) on a fixed time (1 sec or 10 sec) and calculate the frequency or RPM and display them on the LCD screen
LCD: is used for displaying text messages as well as for reading either frequency or RPM
Along with all these, there are two SPDT inputs that select the frequency counter or RPM and decides to take a single or continuous measure in the loop. An LED is also provided to indicate the counting process is active.
Now let’s see the complete circuit.

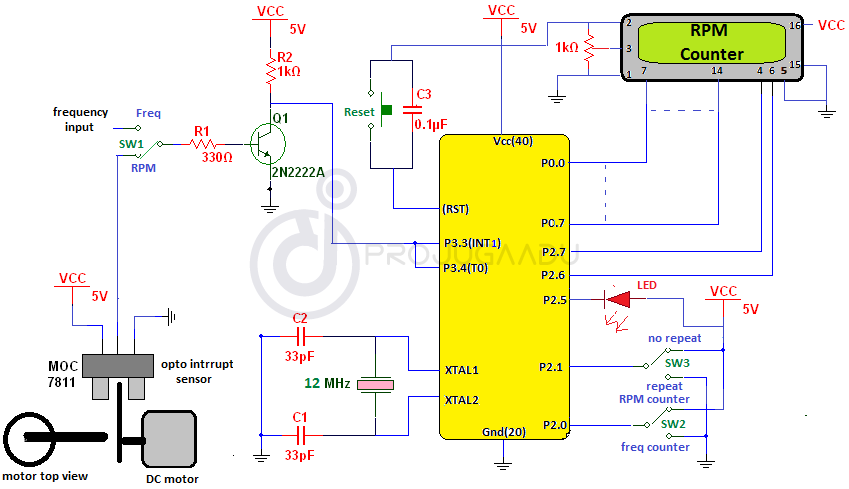
Connections:
- As shown in the figure in the two input connections of the SPDT switch SW1 is direct frequency input.
- Another input of SW1 is connected to the output of the MOC7811 opto-interrupt sensor. For more details or connections MOC7811 refer to its technical data sheet.
- The output line of SW1 is connected to the base input of the NPN transistor Q1 through current limitation of resistance R1.
- Q1 is configured in switch mode so that its output is always 5V or 0V.
- This output is connected to port 3 pins P3.3 and P3.4 which are the INT0 pin and the T0 pin.
- The data pins D0 – D7 (7 – 14) of the LCD are connected to port P0
- Two control pins Rs (4) and En (6) are connected with P2.7 and P2.6 respectively
- The read / write pin (5) is permanently connected to the ground
- Pins 1 and 2 provide polarization voltage, and pins 16 and 15 provide LED backlighting
- A 1K vessel connected to pin 3, as shown to vary the LCD brightness
- A RED LED is connected to P2.5, as shown
- SPDT SW2 switch connected to P2.0 so that it can provide high and low logic entrance to the ac. Same for SW3 connected to P2.1
- The C3 capacitor is connected between the Vcc and the reset input pin (9) to ensure the reset power supply
- A push-button switch is connected in parallel with C3 to provide manual reset
- A 12 MHz crystal together with two capacitors C1 and C2 connected to XTAL1 and XTAL2 provides the clock needed for the microcontroller
Operation and operation:
Both the input signals, either the direct frequency or the pulse output from the sensor are first fed to the wave modeling circuit. As we can see, it is a simple transistor, like a switching circuit, its output is low when its input more than 0.7 V and it is high if the input is less than 0.7 V. So when any type of signal is applied directly (sine wave or any other), it will be transformed into pulses from 0 to 5 V. The output of the sensor is in the pulse is formed but it will be reversed by this circuit.
The pulses are supplied at the external interrupt 1 and the timer input pin 0 of the microcontroller. So microcontroller will start counting these impulses. The LED stays on until the finishes are counted. Now here there are two cases
1. If its frequency counter, the pulses are counted for 1 sec. We will get direct value as number of pulses per second.
2. For RPM we know 1 RPM = 60 RPS. As we get the value of the number of revolutions per Secondly, we will multiply it by 60. But, because the RPM is low, I number rotate for 5 sec and then multiply it by 12. So we will get 12×5 = 60 sec = 1 min that means we get revolutions per minute
This value is then converted to ASCII format and then displayed on the LCD
To change from the frequency counter to the RPM counter and vice versa, change SW2 and SW1 to gather then press the “RESET” button. As the program detects changes in the logic level at pin P2.0, it will be change the measurement parameter.
Each time the countdown ends, the program will check the status of pin P2.1. If its logic 1 this means that the measurement does not stop. For the next measurement, you must press “RESET” again. If P2.1 is at 0 logic, it means that you continue reading after every 5 seconds.
Software logic:
The program loaded in the microcontroller is written in C language and compiled using KEIL (IDE). The complete program is a collection of different functions. The display function displays the 4-digit frequency or RPM value. First, separate all four digits
convert it to ASCII and display them one by one
The interrupt function calculates the external pulses on the input pin T0 for 1 sec or 5 sec.
Delay function is the variable delay function that generates 1 sec or 5 sec for frequency counting or RPM
Four functions are given for LCD operation
1. Writedata – sends data that will be displayed on the LCD screen
2. writecmd – sends the command to use the LCD screen
3. Writestr – Displays various text messages on the LCD screen
4. Busy – wait for the LCD to be ready for accepting the next data or byte
Here is the complete C program with comments.